 by Hatcheon
User Manual
Floodlight v1.1.10-AC
Contents
Introduction
Floodlight - Live diagrams for JIRA is a web-based application which is available via the Atlassian marketplace to teams who already have an instance of JIRA. The app resides in the JIRA instance at a JIRA project level.
Floodlight is designed to:
- enable product teams to visually create and plan product backlogs;
- enable development teams to view their contribution within context of the overall project
- enable all stakeholders to view true development progress of the backlog
Floodlight achieves the above by providing the product team with a diagramming interface within their JIRA project. Diagrams can then be synced to the product
backlog converting visual (diagram) user stories and epics into backlog (list) user stories and epics. During planning sessions user stories and epics can then
be explained to the development team within a visual context ensuring the team has the best possible contextual understanding of the tasks they will work on.
As these user stories and epics are then worked on, so the teams’ progress is displayed by having the colours of each user story and epic change to a
status-based colour:
 |
Light Grey | Not yet linked to a Jira issue |
 |
Grey | Not Started |
 |
Blue | In Progress |
 |
Green | Done |
One JIRA project may have multiple diagrams linked to it.
Instructions
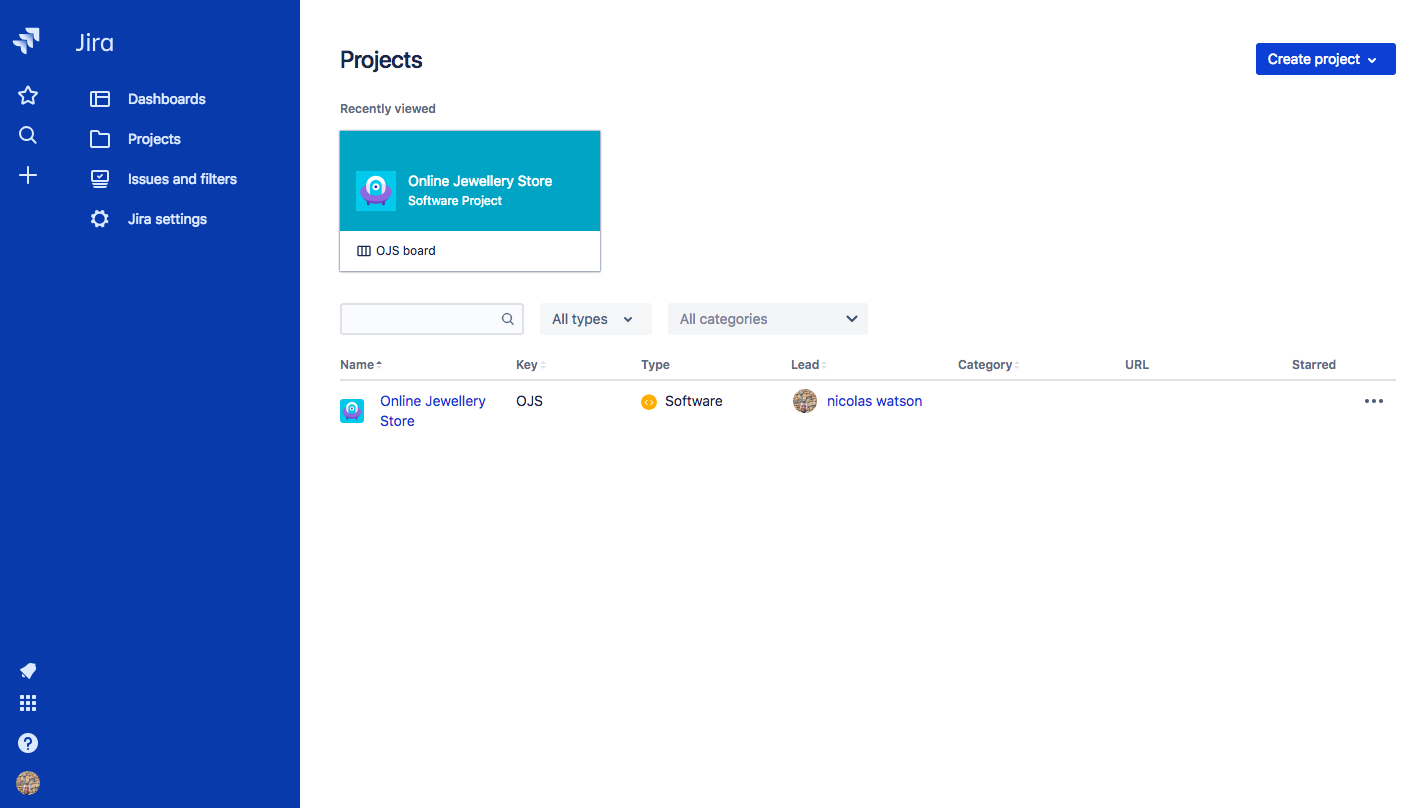
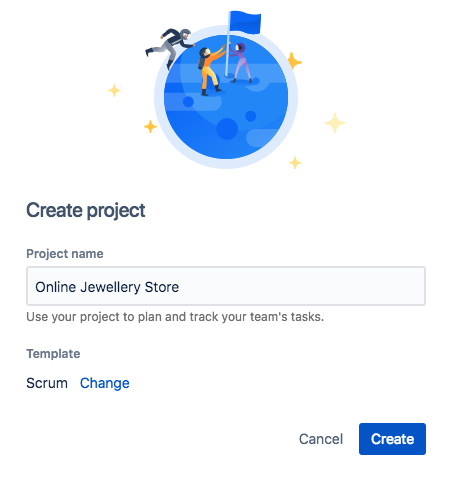
1. Login to your Jira instance and navigate to the project you wish to use. If you don’t already have a Jira project created, navigate to Projects and create a new project.
2. Ensure you set the project template to “Scrum”, “Kanban” or “Agile”.
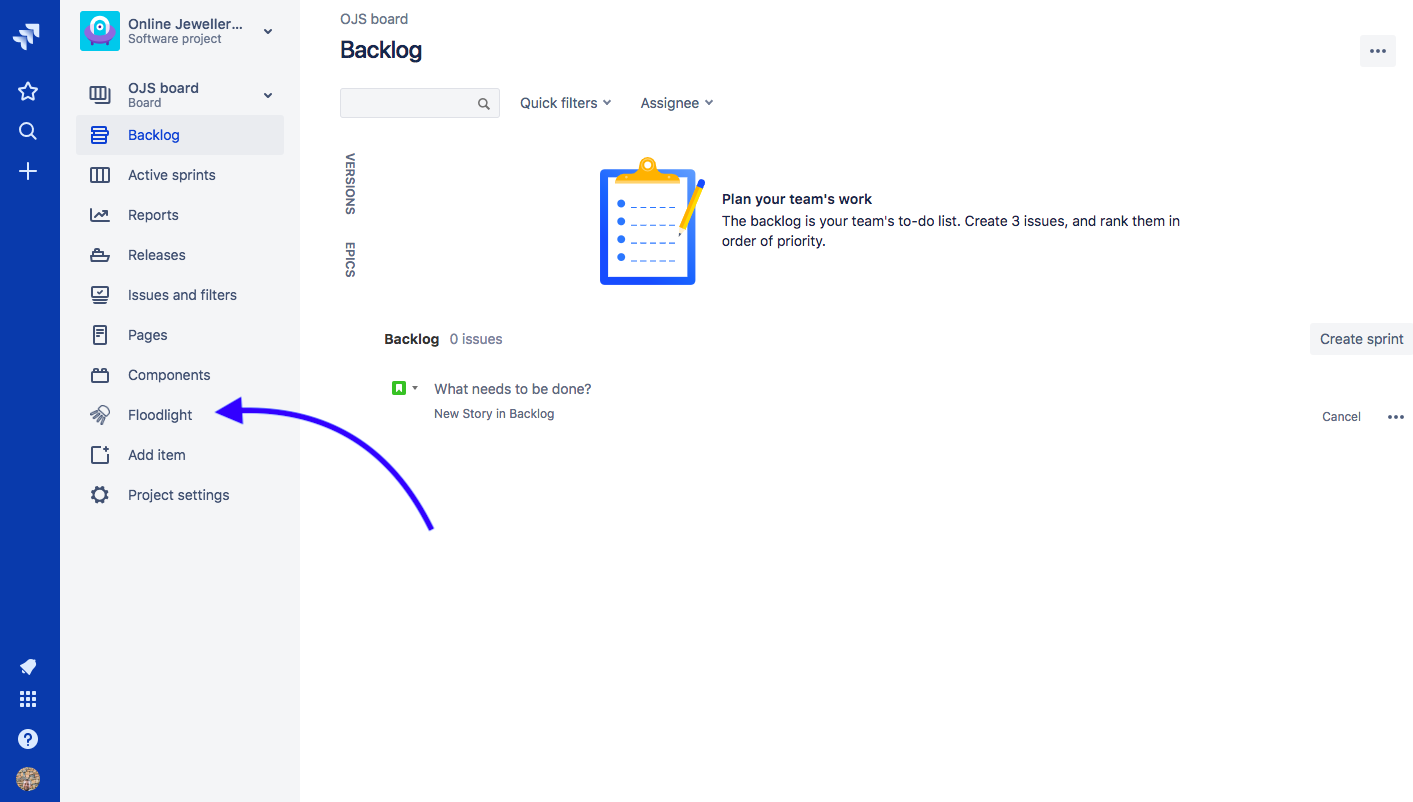
3. Now that the project is created, the Floodlight tab will be made available on the left hand navigation panel within the project. Click on Floodlight to start creating a backlog.
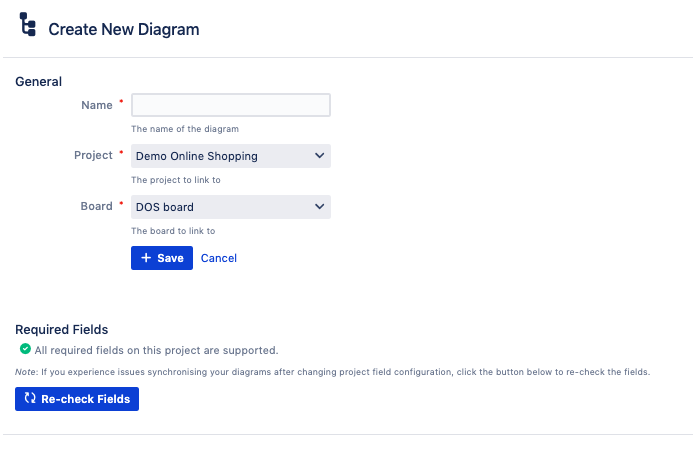
4. Click on “Create Diagram”, enter the name of your diagram. Note that the diagram will automatically be linked to the project from which it is created. The application will also confirm if your Jira field configuration is compatible with Floodlight. If any problems are detected, they will be displayed to you. When done, click “Save”.
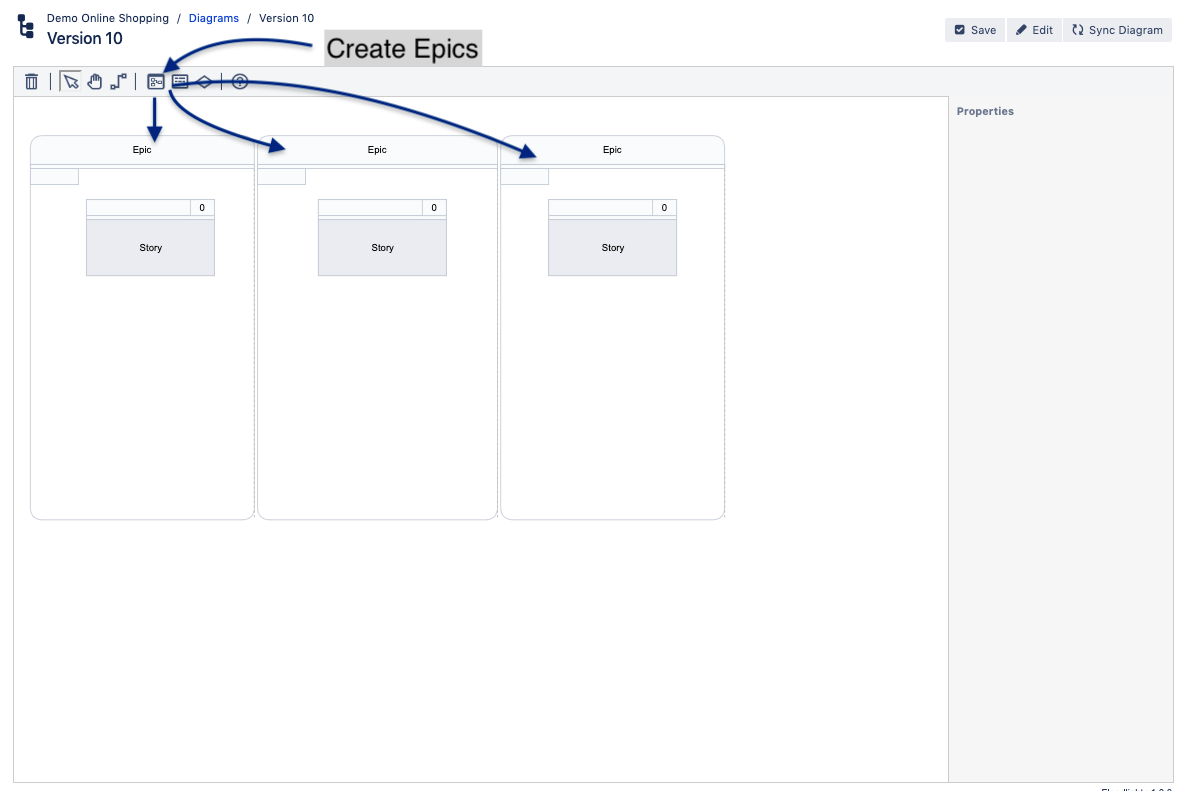
5. Create your Epics by dragging the Epic icon onto the canvas.
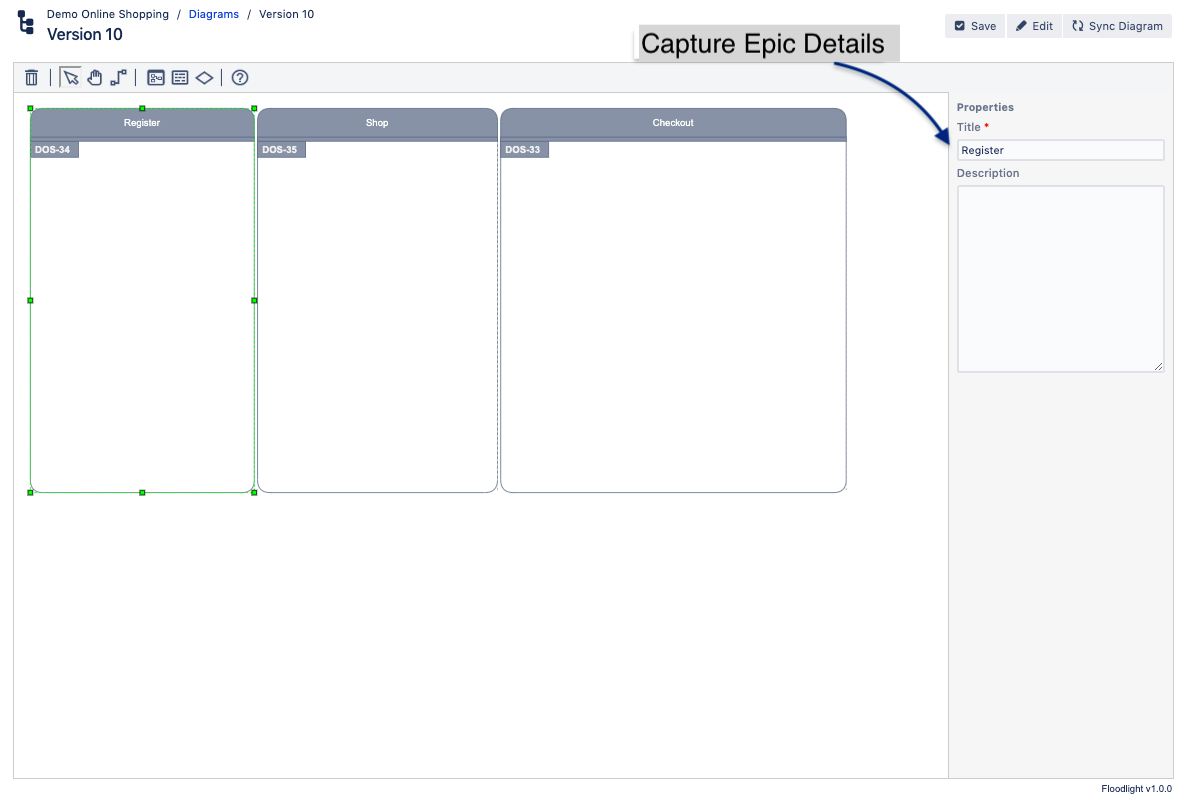
6. Capture the Title and optionally, a Description in the properties section.
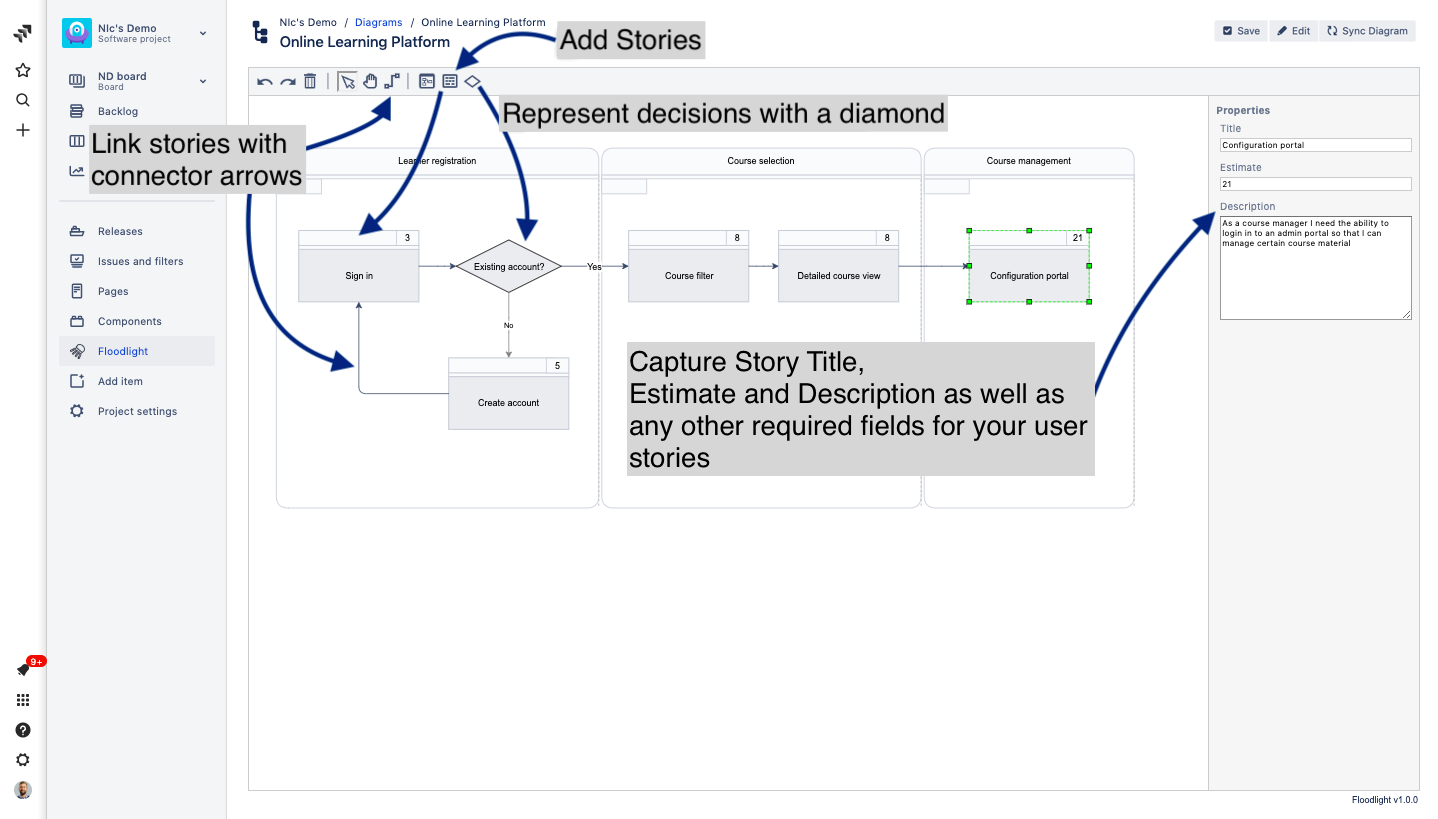
7. Add Stories to the Epics by dragging the Story icon onto the respective Epics. Then capture the properties of each story including Title, Story Points and Description. You can represent decisions with the diamond object. Finally, link the stories by selecting the Arrow function. You can Save your progress at any time by clicking the save button.
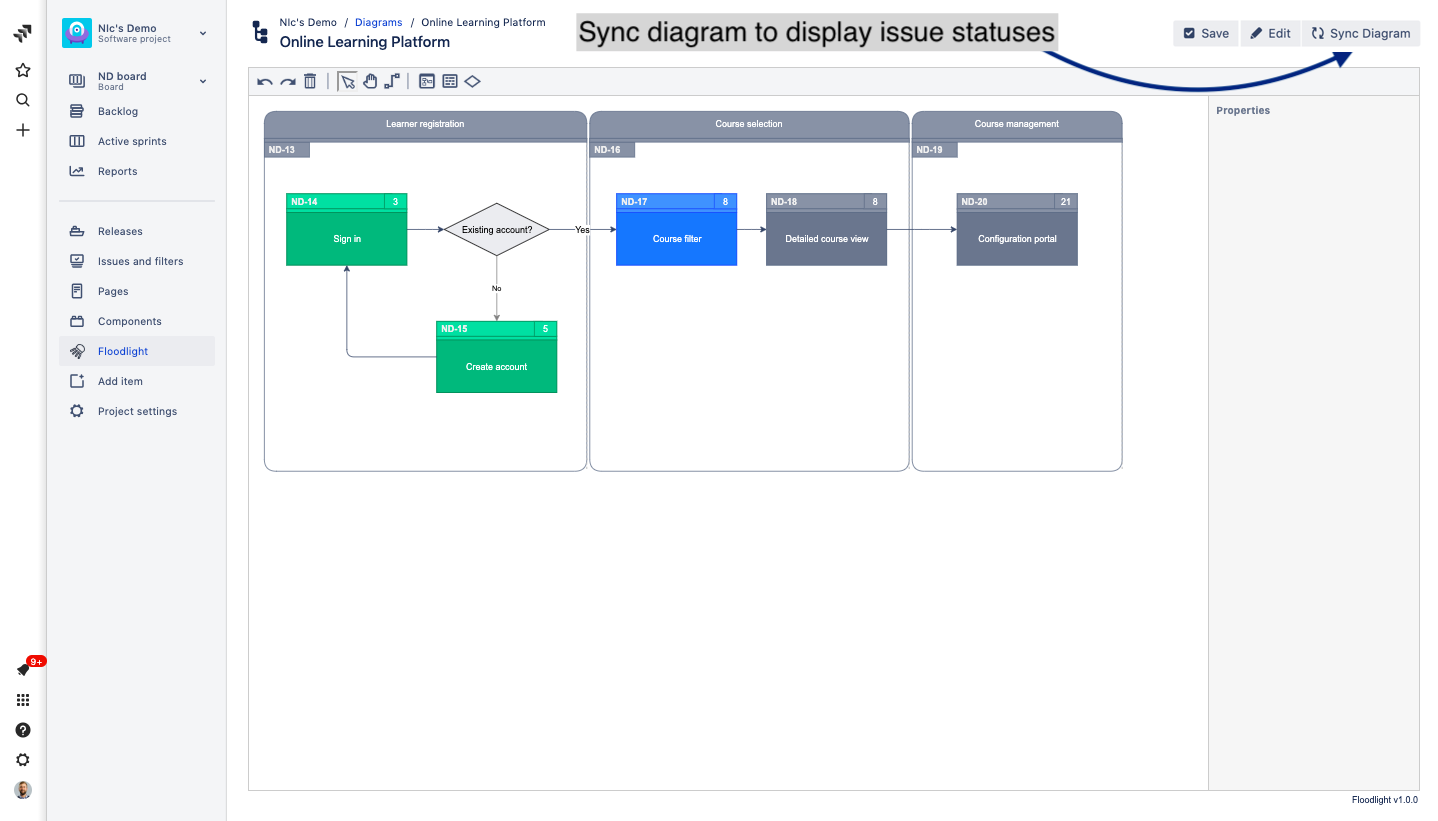
8. Now, to create your backlog click on the “Sync Diagram” button. You will notice the epics and stories on the diagram change to a dark grey colour, indicating that they have been linked to a new issue in Jira. You can click on the issue key on the top right to open the linked Jira issue.
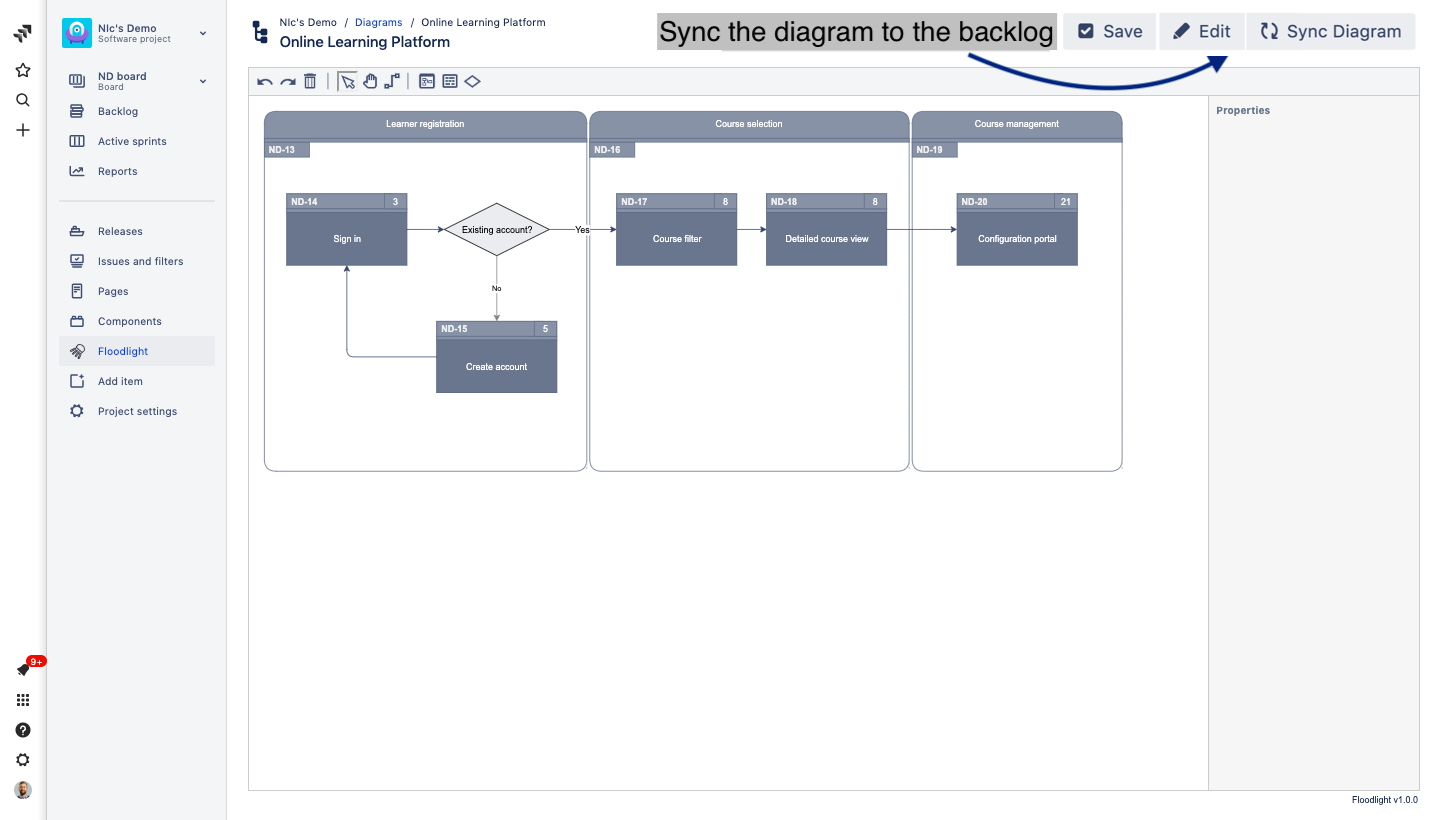
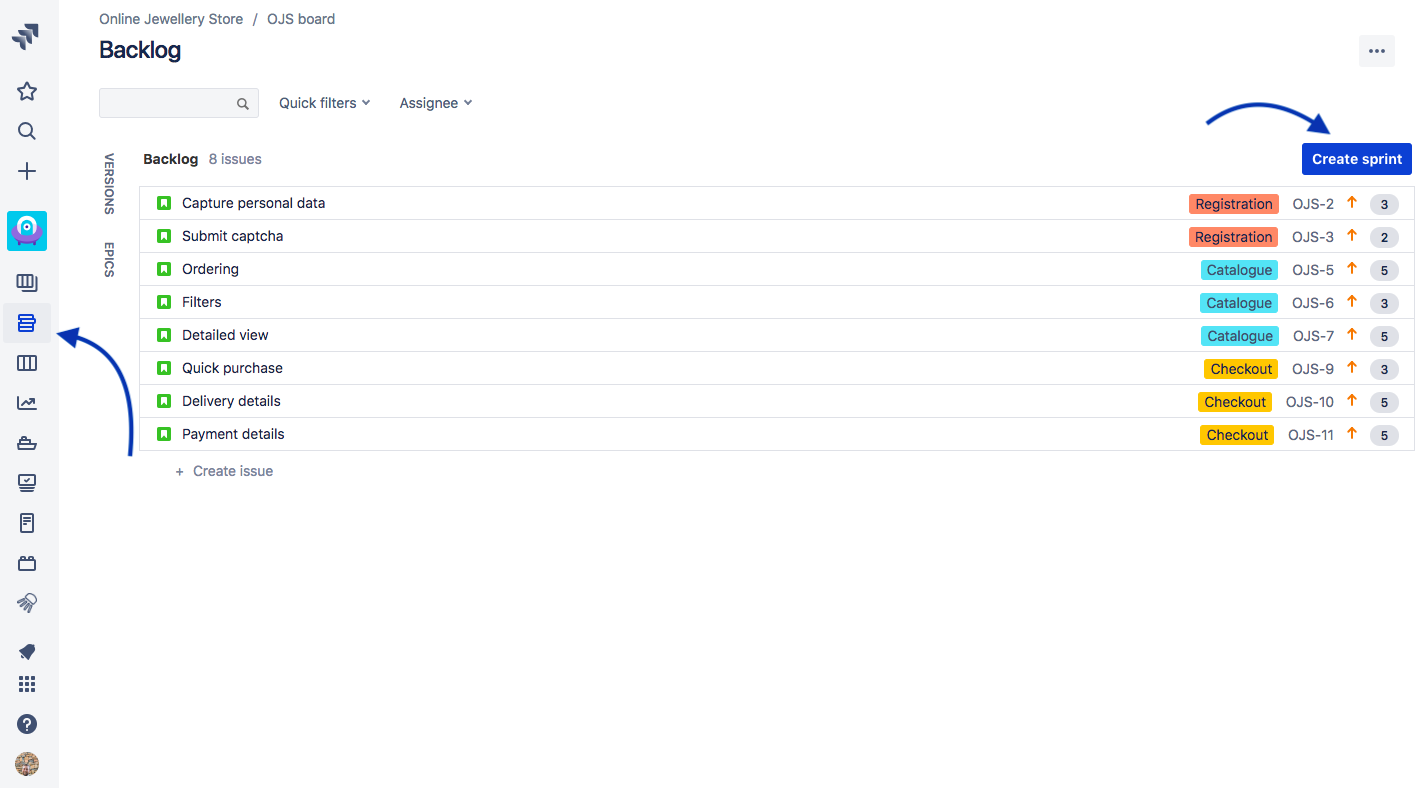
9. Navigate to the Jira project to view your newly generated backlog. Notice that the stories are linked to the correct Epics and that the story points and descriptions have also been synced. As usual, allocate stories to a sprint, and move the stories into “In Progress” and “Done” as work is started or completed.
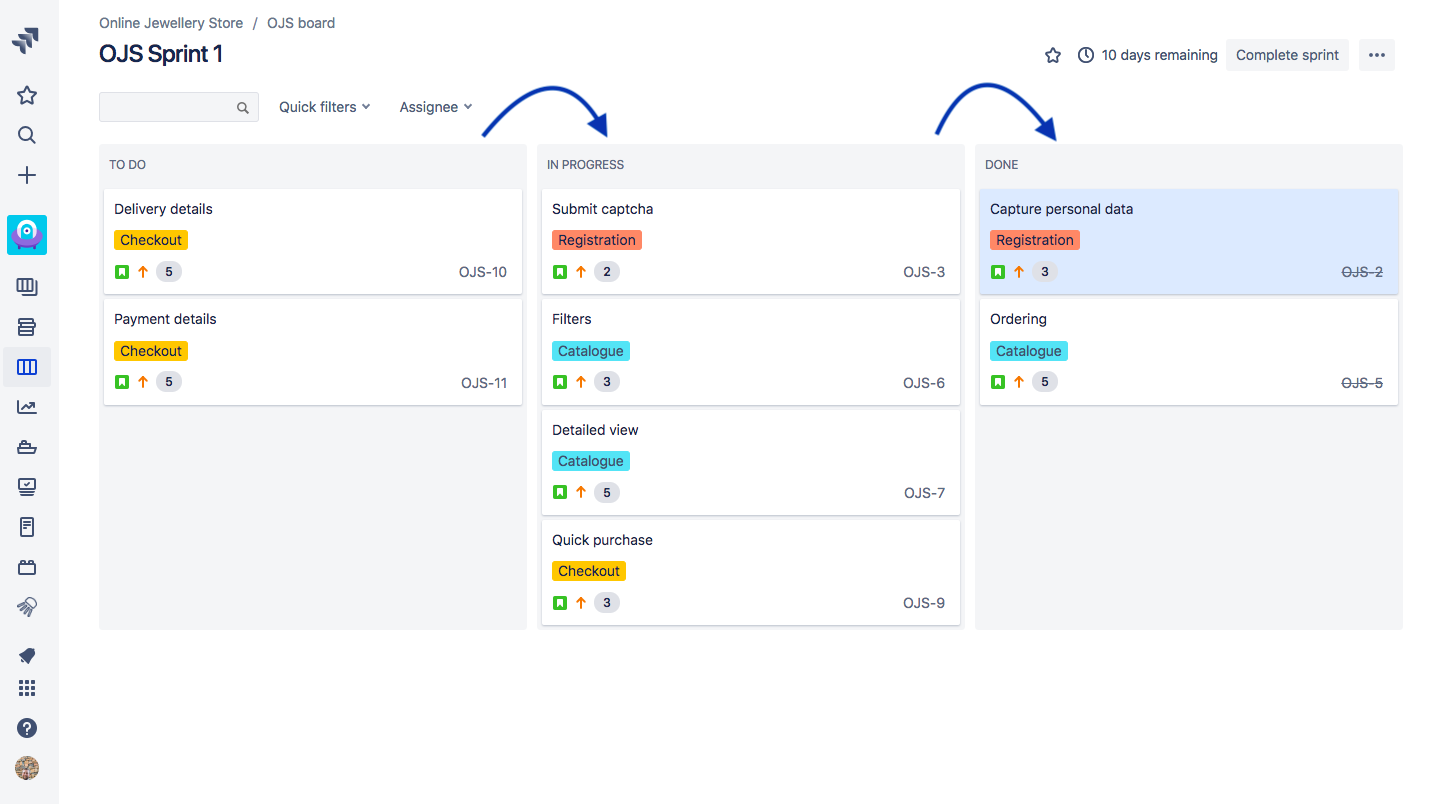
10. Once progress has been made in the sprint, navigate back to Floodlight and click on the “Sync Diagram” button. Notice that the colours of issues update. These colours reflect the following issue statuses:
|
Light Grey | Not yet linked to a Jira issue |
|
Grey | Not Started |
|
Blue | In Progress |
|
Green | Done |